原文题目:Modeling urban canopy air temperature at city-block scale based on urban 3D morphology parameters– A study in Tianjin, North China
作者:李筱睿,杨必胜*,梁福逊,张鸿生,徐勇,董震
来源:Building and EnvironmentDOI: https://doi.org/10.1016/j.buildenv.2023.110000
研究背景:
城市热环境已成为城市可持续发展的核心研究课题之一,研究城市温度对于城市节能、“双碳”政策实施等国家关键需求具有重要意义。城市建筑、植被等相关立体形态因子对城市温度影响深远,作用机制复杂。由于开源气象站测温数据大都远离城市中心且离散分布,较难满足大范围预测需要。相应地,针对大范围且连续分布的冠层气温模拟与预测问题,数值模拟方法成为近年来较为热门的研究课题。然而,多数微气候数值模拟模型受运算成本限制,较难在大范围区域应用,而中尺度数值模拟模型会损失部分模型精度。因此,如何建立起街区尺度上的冠层气温预测模型,并探索冠层气温随城市立体形态因子的变化规律,已成为亟待解决的科学问题。
研究方法:
本文在ENVI-met微气候数值模拟模型中输入由机载点云提取的建筑物及植被三维模型,模拟了天津市主城区在2010年8月5日气象背景下不同局部气候区(LCZ)中典型街区的14:00冠层温度。随后,使用随机森林回归模型,在街区尺度上建立起三种城市立体形态因子(建筑高度BH、建筑覆盖占比BCR、绿地覆盖占比GCR)与街区冠层气温均值的关系模型,并使用该模型预测了天津市2010年、2016年共647km2范围内的街区尺度冠层温度。随后,探索了相同气象条件背景下城市立体形态因子改变对冠层气温的影响。
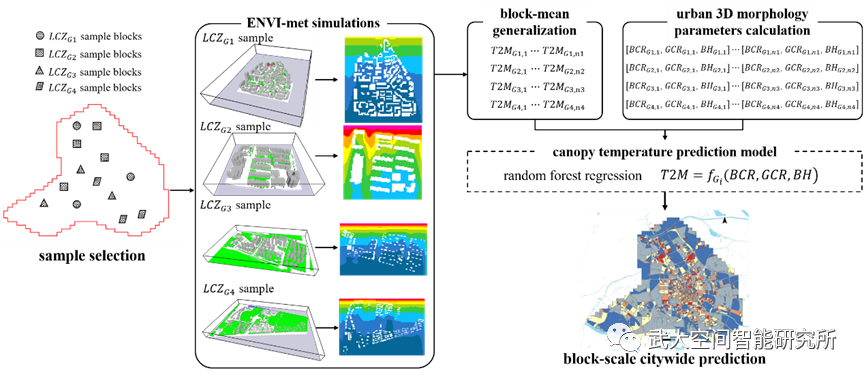
图1 研究方法关键步骤示意图
精度验证:
经验证,本文方法在不同LCZ分组中的RMSE为0.286-0.328℃,R方为0.83。此外,本文将模拟结果分别与气象站空间插值以及最邻近气象站的测温结果进行了对比,均展现出较为优秀的预测效果。
研究结果:
使用建立起的冠层气温模型,分别预测了在相同气象背景条件下天津市主城区2010年、2016年由城市立体形态改变引起的冠层气温分布图。研究表明,2010-2016年间,在相同气象背景条件下,天津市主城区仅由城市立体形态改变引起的冠层气温增加值约为0.22℃,这与由中国生态环境部颁布的《中国应对气候变化的政策与行动2020年度报告》中提到的0.26℃/10年的气温升高结论趋于一致。
图2 相同气象背景条件下的14:00冠层气温预测图 (a)2010年; (b)2016年
- 建筑覆盖占比增加(同时绿地覆盖等比减少)对冠层气温的影响
假设建筑高度保持不变,当建筑覆盖占比的增幅在0-40%范围内时,天津市主城区的冠层气温呈逐渐上升趋势,随后随着建筑覆盖占比的增加,冠层气温稍稍下降,之后保持不变。由街区尺度的冠层气温分布图也可得出类似结论,且远离城市中心街区的气温增幅更为明显,这可能由该部分区域由裸地变为建筑区域的城市化进程导致。
图3 天津主城区冠层气温均值随建筑覆盖占比的变化曲线图
假设地表覆盖保持不变,对于低层建筑:建筑高度小于20m时小幅波动,大于20m后,气温随高度增加呈明显提升趋势;对于多层建筑:建筑高度小于20m时与低层建筑增长幅度相似,随后随着高度增加气温会逐渐下降;对于中高层建筑:建筑高度小于43.6m时气温逐渐下降,随后在31.75-31.8℃小幅波动;对于高层建筑:在高度大于55.8m后,随着建筑高度的增加气温逐渐提升。本文探索出一种冠层气温随建筑高度的非线性变化规律,可为城市规划、可持续发展决策提供参考依据。
本文受国家自然基金重点项目(42130105)、国家杰出青年基金(41725005)支持。
Abstract:
Urban 3D morphology significantly influences the outdoor thermal environment. Understanding the influence of urban expansion in both horizontal and vertical landscapes helps the canopy urban heat island (CUHI) effect mitigation. However, the microscale numerical CUHI models are difficult to be applied for large-area CUHI effect studies. On the other hand, the mesoscale CUHI models make a wider study area workable but lost some of the model accuracies. To perform a large-area study on the CUHI effect with relatively light computing costs and fine accuracy, this paper builds a canopy air temperature predicting model at city-block scale with urban 3D morphology parameters including building coverage ratio (BCR), grass coverage ratio (GCR) and the mean value of building height (BH) to obtain the citywide block-mean 2-m temperature (T2M). The model accuracy was validated through RMSEs and comparison with the mereological station data. The proposed model shows an RMSE of 0.286 °C and an R-square of 0.83. Using the validated model, Tianjin with an area of 647 km2 was performed to investigate the effects of vertical landscape on the canopy air temperature under different scenarios between 2010 and 2016, including the changes in landcover and building heights. It finds that a 40% increase in BCR may lead to the highest canopy air temperature, and the increase of BH may lead to an increase in the canopy air temperature in low-rise and high-rise building areas, but there is an opposite trend in multi-story and mid-rise building areas.